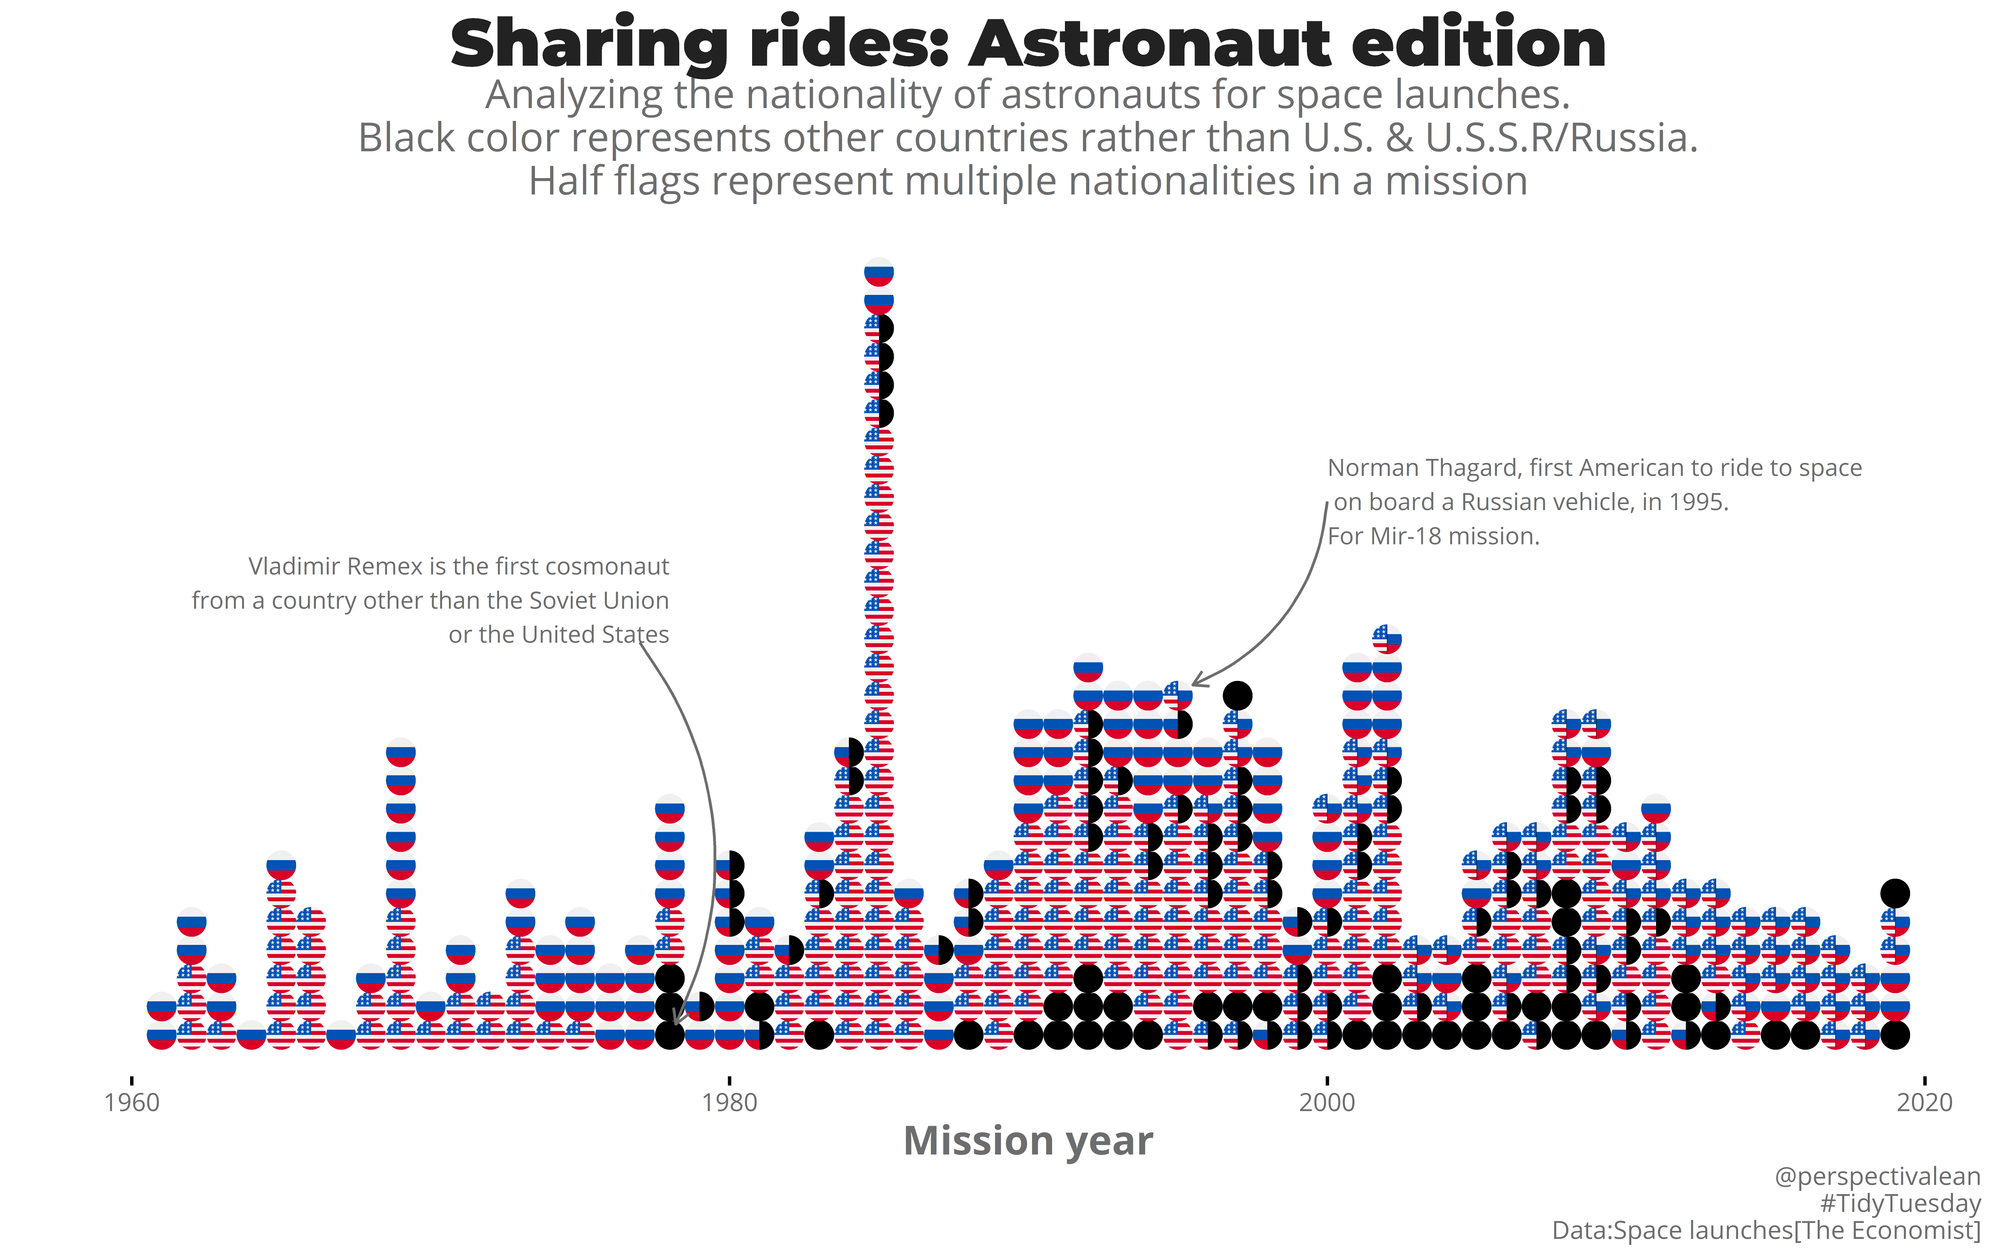
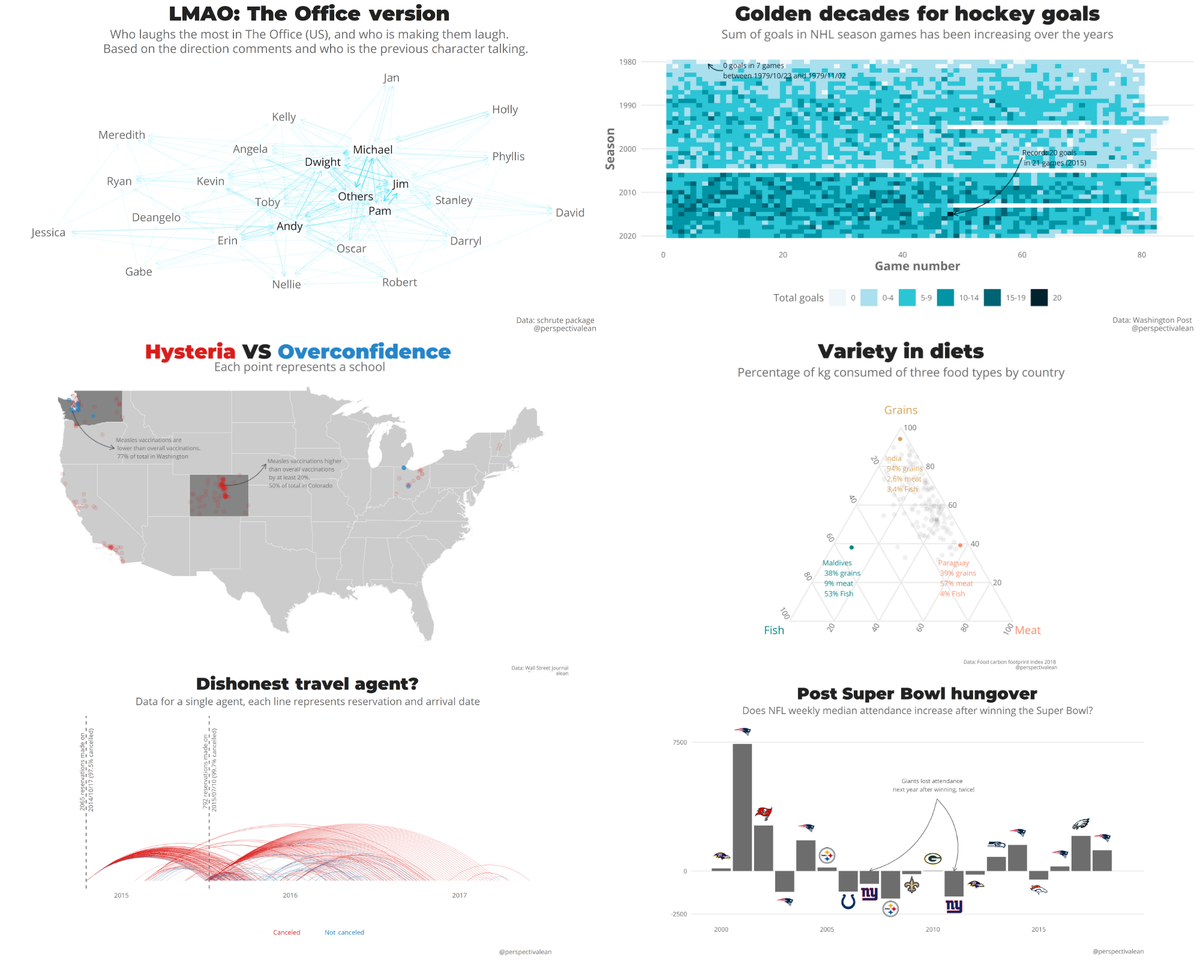
#Tidytuesday visualization challenge
I sent multiple entries to the weekly visualization challenge, using ggplot2 and R.
Did a lot of visualization during 2020, where I learned a lot about ggplot2 and data visualization in general. If you like visualizing data the community around is great to learn from others and ask help.
If you want to see all of them and the code used, check my github page
https://github.com/JoseEchave/tidy-tuesdays